
On this page we use methods and approaches from the Dartmouth Atlas Project to better understand the geography of the ongoing COVID-19 pandemic.
Mapping COVID-19
Track COVID-19 cases, deaths and growth-rates on our Mapping COVID-19 page
Identifying Regional Populations at High-Risk from COVID-19
A Collaborative Project with Microsoft Healthcare NeXT and CareJourney
Download High-Risk from COVID-19 dataset
While people of all ages are at risk of becoming ill from COVID-19, subgroups of the population are at particular risk for complications, hospitalization, and death. According to available evidence from patients in Wuhan, China, COVID-19 disproportionately affects older people and those with specific underlying health conditions. In collaboration Dartmouth, CareJourney and Microsoft Healthcare NeXT researchers created an index that measures the fraction of the total population that is considered at particularly high risk: Medicare beneficiaries over age 65 and with at least two of the following chronic diseases: Diabetes, vascular disease, chronic kidney disease, heart disease, lung disease, and cancer. Conditions were identified using chronic condition indicators from the Centers for Medicare & Medicaid Services (CMS) Chronic Condition Warehouse (CCW). The research team used the most recent data available, 2018 Medicare claims data, along with U.S. Census estimates of the age distribution of the U.S. This novel index may inform public health policy and planning in regions of the country where a spread of COVID-19 might have particularly dire consequences in terms of population health. The data reveal the concentration of highest-risk people, ranging from less than 2% to as much as 22%.
Percentage of Population Age 65 and Older with Two or More Chronic Conditions,
by Hospital Service Area (2018)
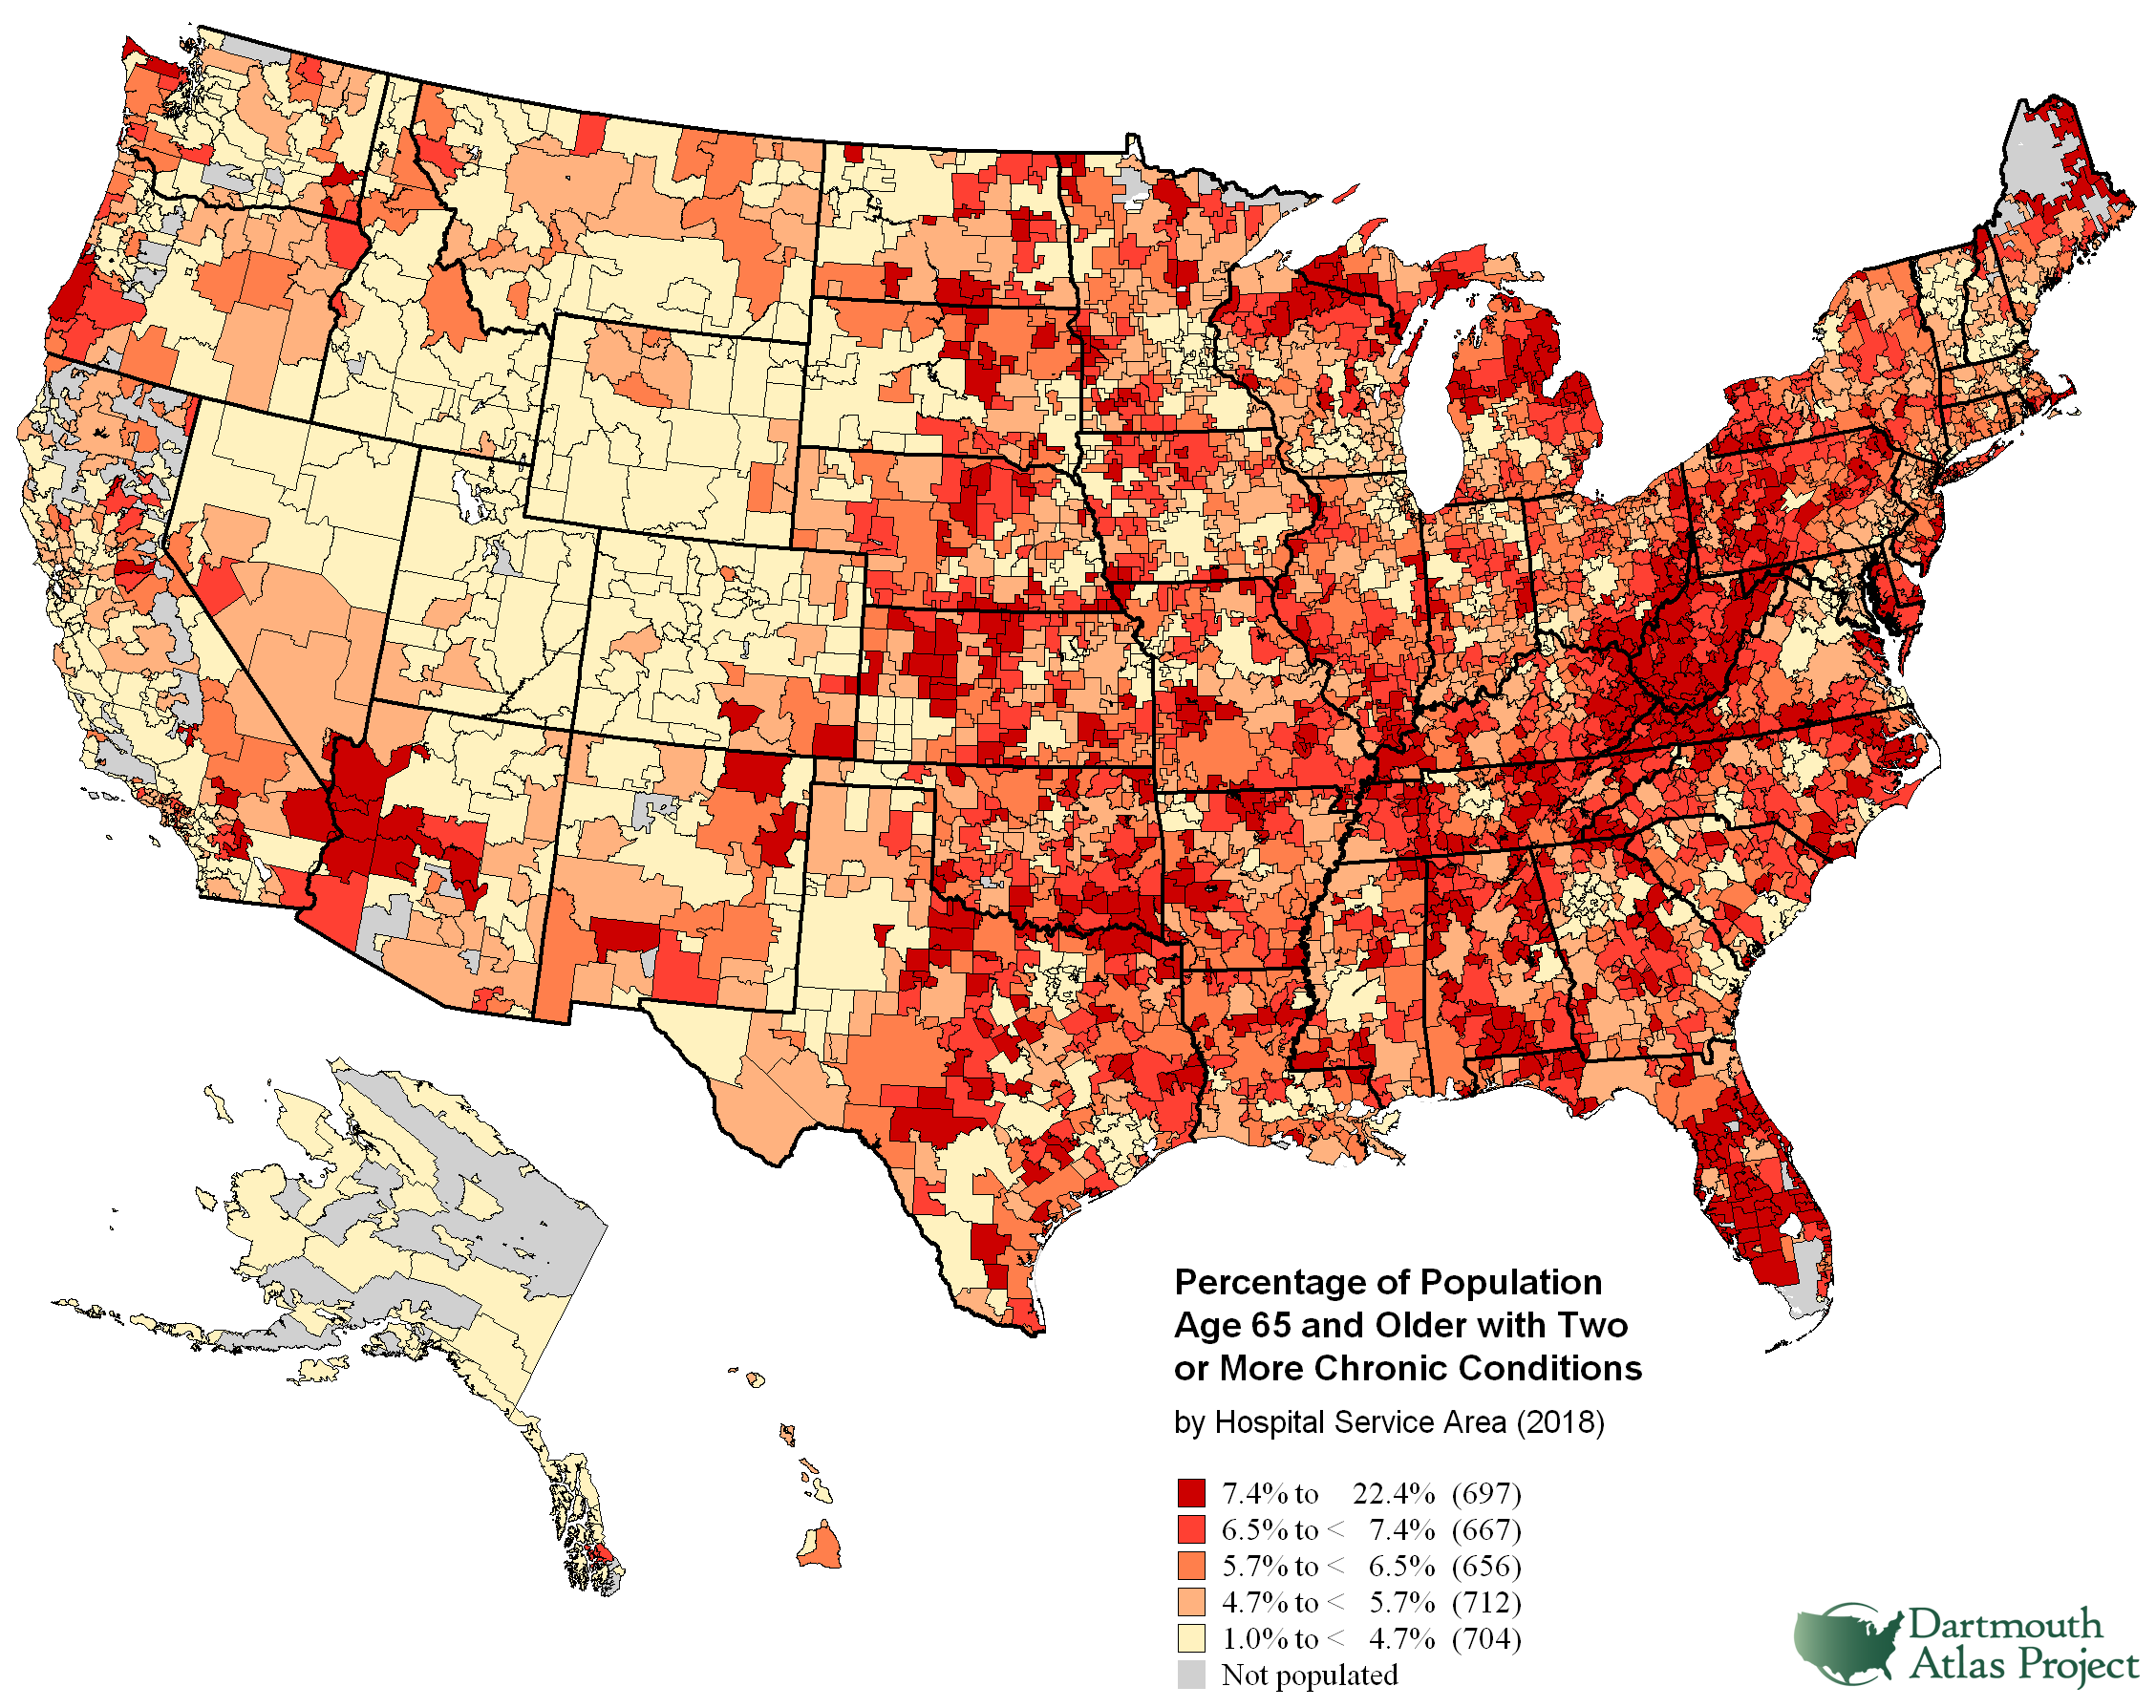
MAP – Percentage of Population Age 65 and Older with Two or More Chronic Conditions, by Hospital Service Area (2018)
Higher Quintile = higher % of older sick peopleAnalysis conducted in collaboration with Microsoft Healthcare NeXT researchers: William Weeks, Nancy Morden, Grace Huynh, James Weinstein, Jonathan Larson, Bryan Tower and CareJourney analysts: Stacey Cao and Zach Bredl
Bed Capacity
The Dartmouth Atlas Hospital and Physician Capacity Update report highlights the uneven distribution of hospital capacity relative to regional need, as well as substantial geographic variation in bed capacity per capita. In this earlier study, we paid considerable attention to allocating acute care bed capacity according to the residence of patients (rather than simply where the beds happened to be located). We also developed this measure using three separate data sets: data from the American Hospital Association (AHA) when available, as well as data from the CMS Provider of Services file and CMS Cost Reports to fill in the gaps for hospitals that did not report their data to the AHA. The most recent update to bed capacity using all three sources was published using data from 2012.
A recent NPR article highlighted bed capacity information using data from the Dartmouth Atlas project. These data included measures derived from AHA data at the hospital referral region level (HRRs are tertiary health care market areas developed using CMS claims data). While the absolute number of acute care beds is understandably higher when a combination of data sources is used, there is a positive correlation (rho=0.9) between the relative rankings of the absolute number of acute care beds at the HRR level when comparing 2018 AHA-only vs. 2012 AHA+CMS Cost Report+POS data. For example, the 2012 Atlas bed capacity rank for Aurora, Illinois was 288th, while the 2018 AHA rank was 267th, among the 306 HRRs – in other words, both indices put that region near the bottom in terms of bed capacity. The correlation is also reasonable, though weaker (rho=0.6), when comparing relative rankings of acute care beds per 1,000. In this case, Aurora ranked 296th for acute care beds per 1,000 residents in the 2012 report using the combination of AHA+CMS Cost Reports+CMS Provider of Services data, compared to 251st using the AHA data only.
Data – Acute Bed Ranking Comparison (.xls)
Atlas Related Media
Our COVID mapping has been cited frequently in the media